
Ethereum’s $1,800 Wall: The Critical Summer 2026 Price Battle

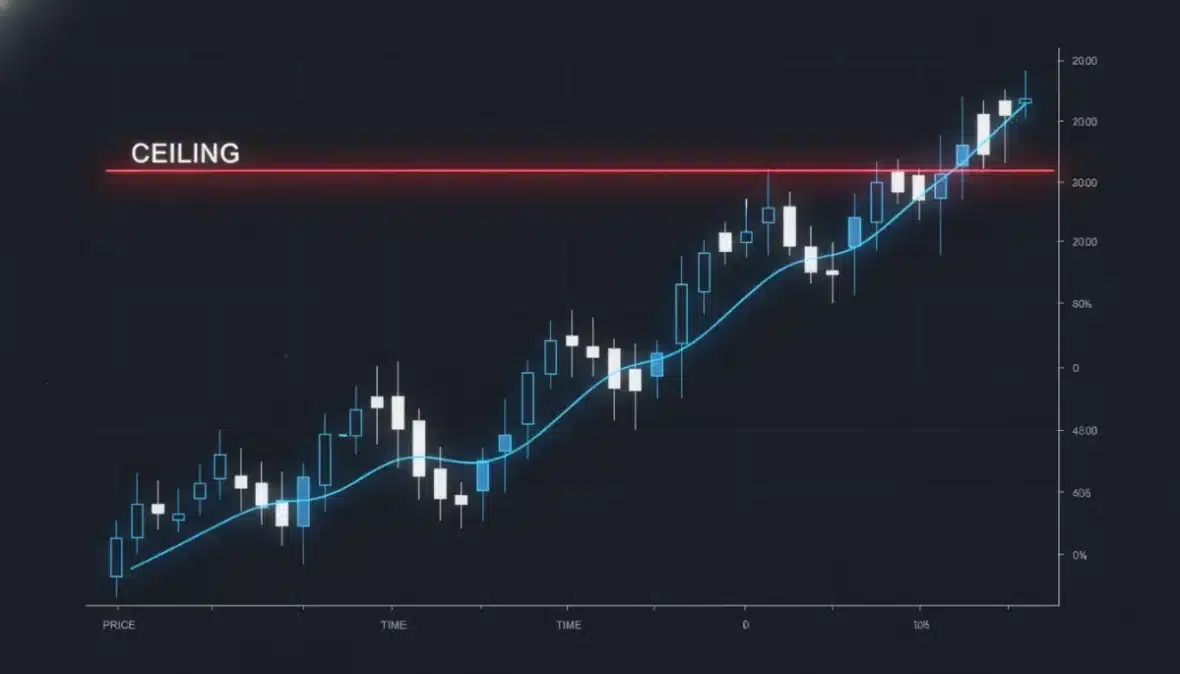
Why $1,800 Is the Linchpin for Ethereum This July
Ethereum is stuck in a high-stakes standoff as of July 13, 2026, with its price hovering near $1,779—just under the critical $1,800 barrier that now defines the summer market. This number isn’t arbitrary; it’s a technical fortress where the daily pivot, the 50-day Exponential Moving Average (EMA50), and short-term resistance levels converge, creating a compression zone that has trapped ETH for weeks.
For bulls to gain momentum, Ethereum needs a decisive, volume-backed close above $1,800 to turn this ceiling into a floor. Until that happens, bears are actively suppressing price to exhaust buyer confidence.
Timeframe Dissonance: Daily Hope vs. Hourly Reality
The market is showing a sharp disconnect between timeframes. On the daily chart, Ethereum holds above its 20-day EMA, and the MACD has just signaled a bullish crossover—a classic bottoming signal that suggests selling pressure is fading.
However, on the 1-hour and 15-minute charts, the story flips: sellers are aggressively defending $1,800, and the Relative Strength Index (RSI) is slipping toward oversold territory. This clash between daily optimism and hourly bearishness makes current trading extremely treacherous—buying without a breakout is like running into a headwind.
Bitcoin’s Shadow and Macro Fear
Ethereum can’t move independently while Bitcoin dominance sits near 56%, siphoning capital away from altcoins. In a risk-off environment shaped by geopolitical tensions and interest rate uncertainty, investors are fleeing to safety—pushing the Fear & Greed Index down to 28, firmly in the “Fear” zone.
When fear dominates, traders prioritize liquidity and exits over altcoin value, leaving Ethereum to fight for scraps of redirected volume.
On-Chain Clues: Repositioning, Not Rallying
A surge in Decentralized Exchange (DEX) activity offers a telling signal. Uniswap V3 fees jumped nearly 49% in 24 hours, and Curve DEX saw a similar volume explosion.
Such fee spikes during a downturn rarely mean new buyers are entering. Instead, they point to active repositioning: investors moving tokens to cold storage, rebalancing portfolios, or hedging against further drops. This twitchy behavior suggests the market is bracing for volatility—not leaning into a bull run.
Two Paths Forward: Breakout or Breakdown
Path 1: The Bullish Breakout
If Ethereum sustains an hourly close above $1,800, the technical landscape shifts instantly. A breach would likely trigger a short-squeeze, forcing resistance bettors to buy back positions and creating a self-fulfilling pump toward $1,825 and potentially $1,884 (upper Bollinger Band).
To bulls, $1,800 is the lock that unlocks real recovery.
Path 2: The Bearish Slide
If $1,800 holds and ETH breaks below $1,753, momentum evaporates. Below that level lies a “structural vacuum” with little historical buying interest, risking a rapid price slip. In a fear-driven market, losing this floor could spark technical selling that tests even hardened holders.
Strategy: Patience Over Panic
The clearest lesson for traders: Don’t fight the range. Flipping coins between $1,753 and $1,800 is a high-risk, low-reward gamble that offers little edge until a confirmed breakout or breakdown occurs.
Patience in this volatile regime is not just prudent—it’s essential.
